This post attempts to use some statistics, figures and plots to assess the accuracy of college football spreads.
First, a few points of context and summary statistics.
- Spreads are an attempt to handicap the game. As such, the points spread or line is set by assigning the favored team a negative number which represents the points that team is expected to win by [1]
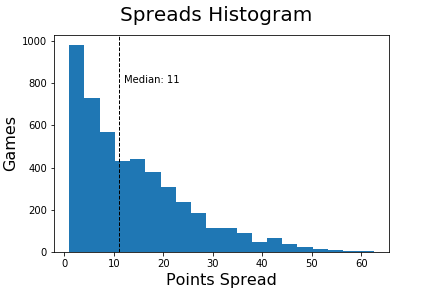
- The median spread in college football is 11 points, however the median spread for games after week 4 which represents the majority of conference play is 9.5 points
- The spread accurately predicted the winner in 75% of games [2]
- Even excluding games with a team favored by 30 or more [3], favorites win 73% of games [4]
We can see from the spreads histogram that the distribution is right skewed. Those below the median the spread correctly predicted the outcome 62% and above the median correctly predicted the outcome 88% [5].
On a more technical note, the spread to margin of victory correlation is -.73 which can be seen in the plot below by the line of best fit. The scatter plot is also color coded blue/red with blue representing games which the spread correctly predicted the outcome and red the opposite. The average error is 12.7 [6] and the average error standard deviation is 9.9 [7].

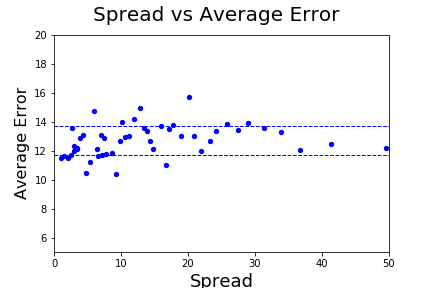
The average error has no relationship to the size of the spread, which can be seen visually below. The chart is comprised of 50 dots, each representing 100 games with an average spread on the x-asis and the average error [6] for that bucket on the y-axis. As the spreads are larger the average error stays within the +/- 1 point band of the populations average. Stated differently, larger spreads are no more inaccurate than smaller spreads.
Looking at 10 buckets of spreads with equal number of games, we see more evidence of the predictive power of points spreads.
| Spread Bracket |
Win Percent (Favorite)
|
| -1 to -3 | 49% |
| -3 to -4 | 61% |
| -4 to -6.5 | 62% |
| -6.5 to -8 | 66% |
| -8 to -11 | 72% |
| -11 to -14 | 76% |
| -14 to -17.5 | 86% |
| -17.5 to -22.5 | 88% |
| -22.5 to -30 | 94% |
| -30 to -62.5 | 98% |
Statistics / Notes
[1] Example Team A -7, Team A is expected to win by 7 points and Team B +7, Team B is expected to lose by 7 points
[2] Favorites won 3,600 of 4,787 games in the five year time frame 2014-2018
[3] Teams favored by 30 points or more win 98% of their games and represent a lot of FBS – FCS match-ups
[4] Favorites won 3,131 of 4,309 games in which the spread was less than 30 points
[5] Of the 2,383 games with a points spread of less than 11, the favorite won 1,480 (1,480/2,383 = .62), of the 2,327 games with a points spread of more than 11, the favorite won 2,055 (2,055/2,327 = .88). The 77 games with a points spread of 11 were excluded.
[6] Average error is defined as the average difference between the spread and the actual game outcome. For example, if the spread is -7 points and the favorite wins by 8, the error would be 1. Alternatively, if the spread is -7 and the favorite loses by 1 the error would be 8.
[7] The standard deviation of the error as defined in [6] is 9.97.
