This post attempts to use some statistics, figures and plots to assess the accuracy of college football totals.
First, a few points of context and summary statistics.
- Totals are an attempt to handicap the combined score of the game. As such, the game total is set by assigning the game a number which represents the aggregate score of both teams. Bettors are then allowed to place a wager on that number but selecting the side (over/under) they wish to wager on. [1]
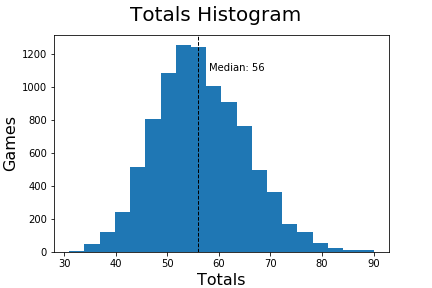
- The median total in college football is 56 points [2]
- In the population, 48% of bets results in an over, 51% in an under and 1% in a push. [3]
The histogram of totals is a normal distribution.
In the graph below, blue represent over bets and green represent under bets. The correlation between the total and the actual total score is .43 with an average error of 12.7 points [4] and average error standard deviation of 9.9 [5].

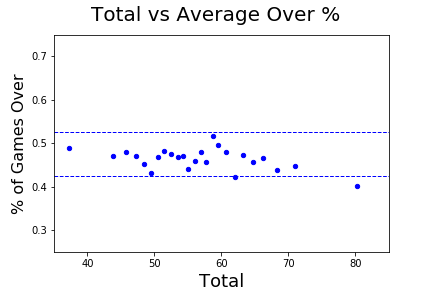
In the graph below, we can see very little relationship between the total and whether it results in an over or under. But to see this more clearly, the following chart are 25 groupings of a range of totals [6] with the average percentage of games with an over result in blue. The dotted lines are +/- 5% of the average, we see only 1 bucket is outside the +/- 5% range and there is no relationship between total and the likelihood of the outcome.
And the same chart for under results, again only 1 bucket outside the +/- 5% range and no visual relationship.

Statistics / Notes
[1] A total bet of 75, with a wager of over, would win if the combined score of the two teams is 76 points or more. Conversely an under wager would win if the combined score of the two teams is 74 points or more. An exactly combined score of 75 would result in a push (i.e., the money is returned to the bettor).
[2] Of the 4,637 games with a total between 2014 and 2018, 2,270 had a total less than 56 and 2,268 had a total greater than 56. The remaining 99 games had a total of 56.
[3] Of the 4,637 games, 2,207 results in an over (2,207/4,637 = .475), 2,361 in an under (2,361/4,637 = .509), and 69 in a push (69/4,637 = .014).
[4] Average error is defined as the average difference between the total and the actual total score. For example, if the total is 70 points and the actual total score is 65 the error would be 5 points.
[5] The standard deviation of the error as defined in [4] is 9.99.
[6] Each grouping has roughly similar numbers of games, roughly 200, and were created using ntile function of SQL. The total shown on the x-axis represents the average total for the grouping. For example, the first group is comprised of totals from 31 to 42.5 with an average total of 37.2, contains 200 games and 49% resulted in an over.
