The Value of the Hook

In sports betting, the hook is paying additional vig to get half a point. In laymen terms, it’s risking a larger amount of money to win the same amount of money to move the spread .5 points in the bettors favor. For example, if wagering on a 3.5 point favorite and buying the hook the spread will now be 3 points. But to gain this advantage the bettor will have to risk $120 to win $100 (120/100) instead of $110 to win $100 (110/100). Thus, the price of the hook was $10 but obtained the bettor a more favorable spread.

A good rule of thumb is that any change to a bet offered will be to the advantage of the party who who takes the bet. This rule applies not just to sports betting but to casino table games generally. An example is the insurance bet in blackjack which reduces variance of outcome but is expected positive value for the dealer.

However, it is possible to determine the value of the hook using a sufficiently large data set of college football games [1]. Using the population of games, the likelihood of the hook influencing the bet’s outcome can be calculated which can then be used to determine the value of the hook.

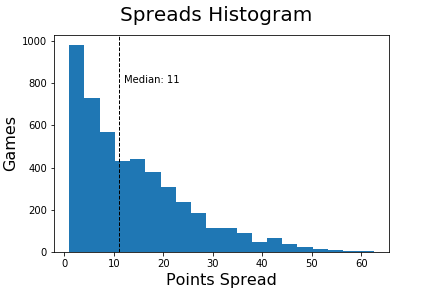
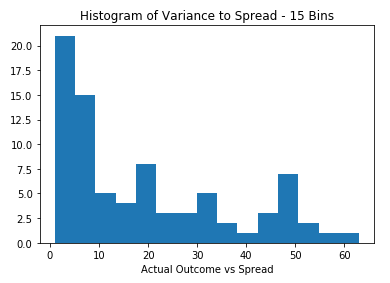
A prior post covered college football spreads and explained the spread error [2] and looked at it as an average and standard deviation. For the purposes of this analysis, it’s helpful to look at a histogram of the spread errors. This visual shows that more than half the spread errors are worth more than a touchdown but the largest histogram bin is zero to the first point so we know many games are close and a point can matter.

spreads_error_histogram


To determine the exact value of the hook, each game must be simulated with the an adjustment to the spread. First for the favorite. Below are 20 data points which recalculate the outcome with the spread changed by half-point increments from .5 to 10 points and the percentage of games that change. The visual is a clear linear line from 0% at zero points to 25% of games at 10 points.

Value of Half-Points


Looking at the incremental change, we see the value of the incremental half-point is within a narrow 1%-1.7% range. This implies that while the first half-point is slightly more valuable (1.7%) than the average over the first 20 half-points (1.2%) the actual number of games that are impacted by the hook is very small. We can safely assume that the hook will impact less than 2% of bets.

Value of Half-Point v2


Popular advise is to buy the the hook for single score spreads (i.e., -3.5, -7.5) where a half-point is the difference between a single score such as a field goal or touchdown. To understand single score spreads and single score games, the following bar chart is game margins with single score games in red [3].

game_margin_bar

Clearly, we can see that these single score game margins are more common than other type of game margins. Games are 2.5 to 3.5 times more likely to end in a 3 or 7 point margin than 2, 4, 6 or 8 points.

The following visual shows that by odds, games with a 2.5-3.5 and 6.5-7.5 point spread are indeed more likely to be impacted [4] by a half-point adjustment with those spreads highlighted in red.

Value of Half-Point v3

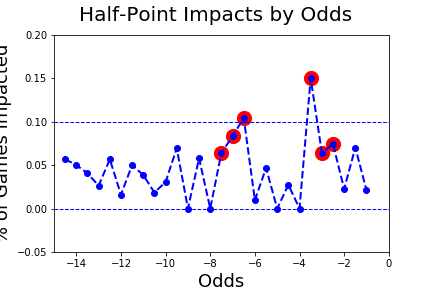
In fact, games with a spread of 2.5-3.5 and 6.5-7.5 are impacted by a half-point in 9% of bets while the average for the entire population is 4.7% of games. And this statistic answers the original question as to the value of the hook. For spreads of 2.5-3.5 and 6.5-7.5, the value of the hook is roughly 4.5% of the bet [5] while for all other games the hook is worth roughly 1.8% of the bet [6]. 


[1] The data set referenced is a 4,718 college football games from 2014-2018 with a spread and outcome.

[2] The spread error is defined as the difference between the spread and the actual game outcome. For example, if the spread is -7 points and the favorite wins by 8, the error would be 1. Alternatively, if the spread is -7 and the favorite loses by 1 the error would be 8.

[3] Single score game is a game result with the winning team margin of victory equal to the two most common scoring events in football, a touchdown plus extra point (7 points) and a field goal (3).

[4] Impacted is defined as a bet outcome which would be changed by a half-point adjustment. Earlier it was noted that a half-point change would cause the favorite to cover in less than 2% of games. However, impacted also includes games where the underdog would now cover as well as games where neither team would cover but a push would now occur. This explains the differential between the ~2% and ~4.5% between the two metrics.

[5] This calculation is approximately half the value of the likelihood of the half-point impacting the game. Importantly you must assume that you have no special insight into the outcome and thus there is a 50% chance your bet will be wrong and the half-point will be irrelevant.

[6] This is lower than the general average as you must remove the higher likelihood odds of 2.5-3.5 and 6.5-7.5 then recalculate the percentage of games impacted which becomes 3.6% compared to 4.7%.

College Football Team Performance vs Spread

This post attempts to use some statistics, figures and plots to assess team performance against college football spreads.

The histogram of season performance of teams against the spread for college football for seasons 2014-2018 [1] is a normal distribution with x% of teams season performance between 25% and 75% [2].

team_performance_spreads_histogram

To see whether a team’s season performance vs the spread carries from one season to the next, the visual below shows the current and prior year performance vs the spread as a scatter plot. No pattern emerges, with 43% of teams declining year over year and 45% of teams improving year over year. The remaining 8% were constant year over year.


team_record_v_spread_yoy_better_or_worse


Looking at the same data differently, the next visual places each team into a quadrant based 50% as the divider. Counting each data point as a percentage of the population, we see that only 13% of teams with a better than 50% performance against the spread in one year perform better than 50% the next year. Additionally, a team with a performance of better than 50% performance in a year is much more likely to under perform the next year than continue a over 50% performance.

team_record_v_spread_yoy


Statistics / Notes

[1] Each data point is a teams season performance against the spread calculated as a percent (games covering spread / total games). In the 2014-2018 timeframe there are 708 teams in the population with at minimum 10 games that included a spread in the season.

[2] In the population 708 games, 673 had a season performance of between 25% and 75%.


College Football Totals

This post attempts to use some statistics, figures and plots to assess the accuracy of college football totals.

First, a few points of context and summary statistics.

  • Totals are an attempt to handicap the combined score of the game. As such, the game total is set by assigning the game a number which represents the aggregate score of both teams. Bettors are then allowed to place a wager on that number but selecting the side (over/under) they wish to wager on. [1]
  • The median total in college football is 56 points [2]
  • In the population, 48% of bets results in an over, 51% in an under and 1% in a push. [3]

The histogram of totals is a normal distribution.

totals_histogram

In the graph below, blue represent over bets and green represent under bets. The correlation between the total and the actual total score is .43 with an average error of 12.7 points [4] and average error standard deviation of 9.9 [5].

total_v_actual_total

In the graph below, we can see very little relationship between the total and whether it results in an over or under. But to see this more clearly, the following chart are 25 groupings of a range of totals [6] with the average percentage of games with an over result in blue. The dotted lines are +/- 5% of the average, we see only 1 bucket is outside the +/- 5% range and there is no relationship between total and the likelihood of the outcome.

total_v_avg_over

And the same chart for under results, again only 1 bucket outside the +/- 5% range and no visual relationship.

total_v_avg_under


Statistics / Notes

[1] A total bet of 75, with a wager of over, would win if the combined score of the two teams is 76 points or more. Conversely an under wager would win if the combined score of the two teams is 74 points or more. An exactly combined score of 75 would result in a push (i.e., the money is returned to the bettor).

[2] Of the 4,637 games with a total between 2014 and 2018, 2,270 had a total less than 56 and 2,268 had a total greater than 56. The remaining 99 games had a total of 56.

[3] Of the 4,637 games, 2,207 results in an over (2,207/4,637 = .475), 2,361 in an under (2,361/4,637 = .509), and 69 in a push (69/4,637 = .014).

[4] Average error is defined as the average difference between the total and the actual total score. For example, if the total is 70 points and the actual total score is 65 the error would be 5 points.

[5] The standard deviation of the error as defined in [4] is 9.99.

[6] Each grouping has roughly similar numbers of games, roughly 200, and were created using ntile function of SQL. The total shown on the x-axis represents the average total for the grouping. For example, the first group is comprised of totals from 31 to 42.5 with an average total of 37.2, contains 200 games and 49% resulted in an over.

College Football Spreads

This post attempts to use some statistics, figures and plots to assess the accuracy of college football spreads.

First, a few points of context and summary statistics.

  • Spreads are an attempt to handicap the game. As such, the points spread or line is set by assigning the favored team a negative number which represents the points that team is expected to win by [1]
  • The median spread in college football is 11 points, however the median spread for games after week 4 which represents the majority of conference play is 9.5 points
  • The spread accurately predicted the winner in 75% of games [2]
  • Even excluding games with a team favored by 30 or more [3], favorites win 73% of games [4]


We can see from the spreads histogram that the distribution is right skewed. Those below the median the spread correctly predicted the outcome 62% and above the median correctly predicted the outcome 88% [5].

spreads_histogram

On a more technical note, the spread to margin of victory correlation is -.73 which can be seen in the plot below by the line of best fit. The scatter plot is also color coded blue/red with blue representing games which the spread correctly predicted the outcome and red the opposite. The average error is 12.7 [6] and the average error standard deviation is 9.9 [7].

spread_v_game_margin

The average error has no relationship to the size of the spread, which can be seen visually below. The chart is comprised of 50 dots, each representing 100 games with an average spread on the x-asis and the average error [6] for that bucket on the y-axis. As the spreads are larger the average error stays within the +/- 1 point band of the populations average. Stated differently, larger spreads are no more inaccurate than smaller spreads.

spread_v_avg_error

Looking at 10 buckets of spreads with equal number of games, we see more evidence of the predictive power of points spreads.

Spread Bracket
Win Percent (Favorite)
-1 to -3 49%
-3 to -4 61%
-4 to -6.5 62%
-6.5 to -8 66%
-8 to -11 72%
-11 to -14 76%
-14 to -17.5 86%
-17.5 to -22.5 88%
-22.5 to -30 94%
-30 to -62.5 98%


Statistics / Notes

[1] Example Team A -7, Team A is expected to win by 7 points and Team B +7, Team B is expected to lose by 7 points

[2] Favorites won 3,600 of 4,787 games in the five year time frame 2014-2018

[3] Teams favored by 30 points or more win 98% of their games and represent a lot of FBS – FCS match-ups

[4] Favorites won 3,131 of 4,309 games in which the spread was less than 30 points

[5] Of the 2,383 games with a points spread of less than 11, the favorite won 1,480 (1,480/2,383 = .62), of the 2,327 games with a points spread of more than 11, the favorite won 2,055 (2,055/2,327 = .88). The 77 games with a points spread of 11 were excluded.

[6] Average error is defined as the average difference between the spread and the actual game outcome. For example, if the spread is -7 points and the favorite wins by 8, the error would be 1. Alternatively, if the spread is -7 and the favorite loses by 1 the error would be 8.

[7] The standard deviation of the error as defined in [6] is 9.97.


NHL Odds

How accurate are NHL odds? To assess this, we review roughly 7,000 individual outcomes over several seasons to understand the predictive power of the odds given to individual NHL games.

By bucketing each team’s odds in each match-up into 25 buckets with each bucket containing roughly 275 games we can look at the range of odds in the bucket, the average odds in the bucket, and the percentage of games in each bucket that won (i.e., win percentage).

As a reminder, the most common NHL bet is a moneyline bet where a wager is placed on a team to win and the odds placed based on the required risk to win a unit. For example, a team favored might be -210 which requires $210 to be risked to win $100, while an underdog might be +150 which requires $100 risked to win $150.

The general trend is that the higher the odds (lower the number) the more likely the team is to win. However, it doesn’t move in lockstep with each bucket. But of the 578 games with the team favored by -200 or more the teams won 66% and of the 203 games with the team favored by +200 or less the underdog won only 34% of the games.

Odds Range Average Odds Win Percentage
-400 to -220 -258 68%
-220 to -200 -206 64%
-200 to -175 -182 68%
-175 to -165 -169 61%
-165 to -155 -160 63%
-155 to -150 -152 57%
-150 to -140 -144 58%
-140 to -135 -138 62%
-135 to -130 -132 53%
-130 to -125 -126 52%
-125 to -115 -120 51%
-115 to -110 -115 48%
-110 to -110 -110 51%
-110 to -105 -105 50%
-105 to 105 89 50%
105 to 110 106 48%
110 to 115 112 44%
115 to 120 118 42%
120 to 130 124 40%
130 to 135 132 44%
135 to 145 140 38%
145 to 155 149 39%
155 to 170 161 32%
170 to 180 173 35%
180 to 320 216 33%

Nebraska Football Against the Spread


 2018 Season

During the 2018 season, Nebraska was favored in 6 games, underdogs in 6 and went 7-5 against the spread. Of the 4 games they won, 4 were games where they were favored. They also lost 2 games in which they were favored.


Opponent Date Spread Outcome Cover Last 5 Last 10
Colorado 9/8/2018 Neb-3 5 point loss No, 8 points 1-3-1 3-6-1
Troy 9/15/2018 Neb-10.5 5 point loss No, 16.5 points 1-4 3-6-1
Michigan 9/22/2018 Neb+18 46 point loss No, 28 points 1-4 2-7-1
Purdue 9/29/2018 Neb+3 14 point loss No, 11 points 0-5 2-7-1
Wisconsin 10/5/2018 Neb+18.5 17 point loss Yes, 1.5 Points 1-4 3-6-1
Northwestern 10/13/2018 Neb+3.5 3 point loss Yes, 0.5 Points 2-3 3-6-1
Minnesota 10/20/2018 Neb-4.5 25 point win Yes, 20.4 Points 3-2 4-6
Bethune Cookman 10/27/2018 Neb-47.5 36 point win No, 11.5 points 3-2 4-6
Ohio State 11/3/2018 Neb+17.5 5 point loss Yes, 12.5 points 4-1 4-6
Illinois 11/10/2018 Neb-17 19 point win Yes, 2 points 4-1 6-4
Michigan State 11/17/2018 Neb-1 3 point win Yes, 2 points 4-1 7-3
Iowa 11/24/2018 Neb+7.5 3 point loss Yes, 4.5 points 4-1 7-3

2017 Season

During the 2017 season, Nebraska was favored in 4 games, underdogs in 8 and went 4-7-1 against the spread. Of the 4 games they won, 3 were games where they were favored. They also lost a game in which they were favored.

Opponent Date Spread Outcome Cover Last 5 Last 10
Arkansas State 9/2/2017 Neb-14.5 7 point win No, 7.5 points 2-3 4-6
Oregon 9/9/2017 Neb+10.5 7 point loss Yes, 3.5 points 2-3 5-5
Northern Illinois 9/16/2017 Neb-10.5 4 point loss No, 14.5 points 1-4 4-6
Rutgers 9/23/2017 Neb-12 10 point win No, 2 points 1-4 4-6
Illinois 9/29/2017 Neb-6 22 point win Yes, 16 points 2-3 4-6
Wisconsin 10/7/2017 Neb+12.5 21 point loss No, 8.5 points 2-3 4-6
Ohio State 10/14/2017 Neb+24 42 point loss No, 18 points 1-4 3-7
Purdue 10/28/2017 Neb+3.5 1 point win Yes, 4.5 points 2-3 3-7
North- western 11/4/2017 Neb+7 7 point loss Push 2-2-1 3-6-1
Minnesota 11/11/2017 Neb+2 33 point loss No, 31 points 1-3-1 3-6-1
Penn State 11/18/2017 Neb+27 12 point loss Yes, 15 points 2-2-1 4-5-1
Iowa 11/24/2017 Neb+5 42 point loss No, 37 points 2-2-1 3-6-1

2016 Season

During the 2016 season, Nebraska was favored in 9 games, underdogs in 4 and went 7-5-1 against the spread. Of the 9 games they won, 9 were games where they were favored. They lost no games in which they were favored.

Opponent Date Spread Outcome Cover Last 5 Last 10
Fresno State 9/3/2016 Neb-29 33 Point Win Yes, 4 Points 4-1 6-4
Wyoming 9/10/2016 Neb-25 35 Point Win Yes, 10 Points 4-1 7-3
Oregon 9/17/2016 Neb-3 3 Point Win Push 3-1-1 6-3-1
North- Western 9/24/2016 Neb-9 11 Point Win Yes, 2 Points 4-0-1 6-3-1
Illinois 10/1/2016 Neb-20.5 15 Point Win No, 5.5 Points 3-1-1 6-3-1
Indiana 10/15/2016 Neb-3.5 5 Point Win Yes, 1.5 Points 3-1-1 7-2-1
Purdue 10/22/2016 Neb-24.5 13 Point Win No, 11.5 Points 2-2-1 6-3-1
Wisconsin 10/29/2016 Neb+9.5 6 Point Loss Yes, 3.5 Points 3-2 6-3-1
Ohio State 11/5/2016 Neb+17.5 59 Point Loss No, 41.5 Points 2-3 6-3-1
Minnesota 11/12/2016 Neb-6.5 7 Point Win Yes, 0.5 Points 3-2 6-3-1
Maryland 11/19/2016 Neb-13 21 Point Win Yes, 8 Points 3-2 6-3-1
Iowa 11/25/2016 Neb+3 30 Point Loss No, 27 Points 3-2 5-4-1
Tennessee 12/30/2016 Neb+9.5 14 Point Loss No, 4.5 Points 2-3 5-5

2015 Season

During the 2015 season, Nebraska was favored in 7 games, underdogs in 5, a pick’em in 1 and went 7-6 against the spread. Of the 6 games they won, 3 were games where they were favored and 1 was a pick’em. They lost 4 games in which they were favored.

Opponent Date Spread Outcome Cover Last 5 Last 10
BYU 9/5/2015 Neb-5 5 Point Loss No, 10 Points
South Alabama 9/12/2015 Neb-27.5 39 Point Win Yes, 11.5 Points
Miami 9/19/2015 Neb+3.5 3 Point Loss Yes, 0.5 Points
Southern Miss 9/26/2015 Neb-20.5 8 Point Win No, 12.5 Points
Illinois 10/3/2015 Neb-3.5 1 Point Loss No, 4.5 Points 2-3
Wisconsin 10/10/2015 Neb+2.5 2 Point Loss Yes, 0.5 Points 3-2
Minnesota 10/17/2015 Pick’em 23 Point Win Yes, 23 Points 3-2
North- Western 10/24/2015 Neb-7 2 Point Loss No, 9 Points 2-3
Purdue 10/31/2015 Neb-8 10 Point Loss No, 18 Points 2-3
Michigan State 11/7/2015 Neb+4 1 Point Win Yes, 5 Points 3-2 5-5
Rutgers 11/14/2015 Neb-7.5 17 Point Win Yes, 9.5 Points 3-2 6-4
Iowa 11/27/2015 Neb+2.5 8 Point Loss No, 5.5 Points 2-3 5-5
UCLA 12/26/2015 Neb+5 8 Point Win Yes, 13 Points 3-2 5-5

How Accurate are NFL Spreads?

How accurate are NFL spreads? To understand that, we can review some basic statistics regarding 1,536 regular season NFL games from 2012 to 2017. The median spread of these games was 4, the median outcome was 27-17. Of those games, the favorite won 66% of the games, which is somewhat lower than college basketball.

The median variance against the spread was 8, but as you can see below the variance ranged from many games less than 5 points (i.e., very accurate spreads) to games off by more than 30 points (i.e., very inaccurate spreads).

Histogram of NFL Spread

So how accurate are NFL spreads? Pretty accurate but not perfect.

Does More Data Make Vegas More Accurate?

In a previous post we looked at the accuracy of spreads for college basketball games. But one simple critique would be that yes, spreads may not be as accurate as first thought but that is because for a large part of the season Vegas isn’t working with much data. Preseason and Postseason polls are often quite different and teams under and over perform every season.

So does having more data improve the accuracy of spreads? This is relatively easy to determine. We just need to look across seasons and months to determine if the spreads in February and March are more accurate than those in November and December.

Season Nov Dec Jan Feb Mar Season Median
12-13 8.0 6.5 7.0 7.0 7.0  7.0
13-14 7.0 7.0 7.0 6.5 7.0  7.0
14-15 7.0 7.5 7.0 7.5 6.0  7.0
15-16 7.0 7.0 7.0 7.0 7.0  7.0
16-17 7.25 7.0 7.0 7.0 6.5  7.0
17-18 8.0 7.5  7.0  –
5-yr Median 7.5 7.0 7.0 7.0 7.0 7.0

So is there a pattern? It does seem that November has the least accurate spreads, but that is only by a small margin of half a point. And while in some seasons March is the most accurate, in others is falls in line with the season median.

So does more data make Vegas more accurate? A little.

What’s More Likely? Part 1

This is the first in a multi-part series of posts where we look at whether a characteristic about a game has any relationship to which team will cover. In this post, we will explore whether the favorite or the underdog is more likely to cover the spread. To do this, we will work with the data set of college basketball games to determine whether the favorite or underdog is more likely to cover the spread.

First, some high level statistics. In the 22,215 games, the favorite covered 49% of the games, the underdog covered 48.9% of the games and 2.1% of games ended in a push (i.e., the outcome of the game matched the spread and neither team covered). So, neither the favorite or the underdog is more likely to cover the spread all else equal.

Is the Home Team More Likely to Cover the Spread?

No. In the 16,039 games the home team was favored they covered the spread in 8,037 games (50.1%). Conversely, the away underdog covered 8,002 spreads (49.9%). In the 5,713 games the home team was an underdog they covered the spread in 2,821 games (49.4%) and the away favorite covered 2,892 games (50.6%). In 463 games the spread resulted in a push.

So the home team is more likely to be favored but no more likely to cover than an away underdog. And the home underdog is no more likely to cover than the away favorite. So no pattern here…

Does the Size of the Spread Matter?

Another reasonable consideration is the size of the spread. Let’s see if a big favorite is more or less likely to cover the spread?

Putting the size of the spreads into 10 bins, we see no pattern.

  • A 1 point favorite has a 51% chance to cover the spread
  • A 16 point favorite has a 50.4% chance to cover the spread.

So no pattern here either….

Spread Range Favorite Covers Underdog Covers Favorite Covers %
-1 to -1.5 813 778 51.0%
-2 to -2.5 1,045 1,050 49.9%
-3 to -3.5 976 994 49.6%
-4 to -5 1,404 1,401 50.0%
-5.5 to -6 905 858 51.3%
-6.5 to -7.5 1,202 1,214 49.8%
-8 to -9.5 1,249 1,262 49.7%
-10 to -12 1,092 1,132 49.1%
-12.5 to -15.5 1,079 1,054 50.6%
-16 or more 1,135 1,115 50.4%

There are many more factors that could contribute, but from the data available, we can conclude that neither playing at home, on the road, with a large spread or a small spread has any relationship to whether a team covers the spread.

How Likely Was It That A 1 Seed Would Lose?

On March 16, 2018 the University of Maryland Baltimore County (UMBC) beat the University of Virginia 74-54. This was the first time in the history of the NCAA tournament that a number one seed was upset by the number sixteen seed. Prior to the UMBC win, the one seed was 135-0 when playing the sixteen seed in the NCAA Tournament.

While this upset was historic, how likely was it to happen? To understand that, we can look at spreads of games similar to the typical one-sixteen matchup, then see how often the underdog team wins the game. The idea here being if you want to know how likely it is that a 20 point favorite loses, we just need to look at a lot of games where a team was favored by 20 points and see how often the 20 point favorite loses. There is more detail on this idea in this post.

First, we need to understand the range of spreads for a typical one seed vs. sixteen seed game. A small sample will suffice here given the relatively small total population of 136 games. We will use the median* range of spreads in each year to prevent outliers from influencing the analysis.

Year Largest Spread Second Largest Spread Third Largest Spread Smallest Spread Median Spread
2018 Villanova -22.5 Virginia -20.5 Xavier -19.5 Kansas -14 Median Spread -20
2017 North Carolina -26.5 Villanova -25 Gonzaga -23.5 Kansas -23 Median Spread -24
2016 Kansas -24.5 North Carolina -23.5 Virginia -23 Oregon -23 Median Spread -23
2015 Kentucky -35 Duke -22.5 Villanova -22 Wisconsin -20.5 Median Spread -22
4-year Median -25.5 -23 -22.5 -21.5 -22.5
*In the event of a half point, I rounded down to avoid quarter point median spreads.

For this analysis, we will use the 4-year median range so as to avoid outliers like the 2015 Kentucky -35 spread and the 2018 Kansas -14 spread. In the population of 517 games from the data set that fell within the range. The favorite won 506 (97.9%) games and the underdog won 11 (2.1%) games. Given the number of games played prior to the Virginia upset, statistically we’d have expected the 16 seed to have won 2.9 games in the 136 total games played.

So, using historical spread data, a reasonable argument could be made that it was about time a 16 seed won in the NCAA tournament.